Observability -- Tracing Multi-Agent Workflows with OpenTelemetry
How to instrument multi-agent systems with OpenTelemetry — auto-instrumented traces across agents, LLM calls, and database queries.
When a user asks “Where is my order?”, the request travels through 3 services, 2 LLM calls, and 4 database queries. The orchestrator receives the message, calls the LLM to classify intent, delegates to the order management agent via A2A protocol, which calls its own LLM, executes a tool that queries the database, and returns a response that the orchestrator synthesizes into a human-readable answer.
That is the happy path. Now imagine it takes 12 seconds instead of 3. Which step is slow? Is the LLM taking longer than usual? Did a database query miss an index? Is the network hop between agents introducing latency? Without observability, you are guessing. With six agents, three LLM providers, a database, and Redis all in play, guessing does not scale.
The fix is OpenTelemetry, wired in with a single function call per agent. That one call buys distributed traces across every service, auto-instrumented LLM and database spans, and a dashboard where you can watch exactly what happened during any request.
Why Observability Is Critical for Agents
Traditional web services are relatively predictable. A REST endpoint receives a request, runs some business logic, queries a database, returns a response. The call graph is deterministic.
AI agents break that assumption in a few ways:
- Non-deterministic execution paths. The same input can produce different tool-call sequences depending on the LLM’s reasoning. “Show me running shoes under $100” might trigger semantic search one time and a category filter the next. You cannot predict which code path runs.
- Multi-service call chains. One message fans out across specialists: product discovery for search, pricing for discounts, inventory for stock. Each hop adds latency and a new place to fail.
- LLM latency dominates. In a traditional service, the database query is usually the bottleneck. Here, LLM calls routinely take 1-5 seconds each, so two calls in one request (classification plus specialist reasoning) is 2-10 seconds of wall time from inference alone.
- Tool failures are silent by default. When a tool raises, the LLM gets an error message and tries to recover. To the user the answer just looks slightly off. Without tracing, you can’t see which tool failed or why.
These characteristics make traditional logging insufficient. You need distributed traces that show the full lifecycle of a request across every service boundary, every LLM call, and every database query.
OpenTelemetry Primer
OpenTelemetry (OTel) is the industry-standard framework for collecting telemetry. It gives you three signal types, plus the span primitive that traces are built from:
- Traces represent the full lifecycle of a request. A trace is a tree of spans: when a user sends “Where is my order?”, it captures every operation from the initial HTTP request through LLM calls, inter-agent communication, tool execution, and database queries, all under one
trace_id. - Spans are the individual operations within a trace. Each has a name, duration, status, and attributes, and they nest: an HTTP span contains an LLM-call span, which contains a tool-execution span, which contains a database-query span. The parent-child structure shows exactly where time goes.
- Metrics are aggregated measurements: request counts, latency histograms, error rates. Where traces capture individual requests, metrics give the big picture: requests per minute, p99 latency, the share of LLM calls that fail.
- Logs with trace correlation bridge traditional logging and distributed tracing. When a Python
logger.warning("User not found")fires inside a traced request, OTel injects thetrace_idandspan_id, so you jump from a log line straight to the trace that produced it.
In ECommerce Agents, all four signals flow to a single destination: the .NET Aspire Dashboard.
Setup: One Function Call
Every agent in ECommerce Agents initializes telemetry with a single call during startup. Here is the orchestrator’s lifespan:
@asynccontextmanagerasync def lifespan(app: FastAPI): setup_telemetry("ecommerce.orchestrator") instrument_fastapi(app) await init_db_pool() logger.info("orchestrator.started") yield await close_db_pool()And a specialist agent follows the same pattern:
async def on_startup(app): setup_telemetry("ecommerce.product-discovery") instrument_fastapi(app) await init_db_pool()That setup_telemetry() call does all the heavy lifting. Here is what happens inside:
def setup_telemetry(service_name: str, service_version: str = "1.0.0") -> None:    global _initialized    if _initialized:        return
    if not settings.OTEL_ENABLED:        logger.info("OpenTelemetry disabled (OTEL_ENABLED=false)")        _initialized = True        return
    try:        _do_setup(service_name, service_version)        _initialized = True        logger.info("OpenTelemetry initialized for %s", service_name)    except Exception:        logger.exception(            "Failed to initialize OpenTelemetry — continuing without telemetry"        )        _initialized = True
A few choices inside that wrapper matter:
- Idempotent. The
_initializedguard lets you callsetup_telemetry()repeatedly with no side effects, which matters in tests and when agent startup order is unpredictable. - Graceful degradation. If the Aspire Dashboard is unreachable or an OTel dependency is missing, the agent logs a warning and keeps running. Telemetry failure never takes down the application.
- Environment-controlled.
OTEL_ENABLED(defaultfalse) means telemetry adds zero overhead where you don’t want it. Flip it totruein Docker Compose or your deployment manifests.
The _do_setup() function configures the three OTel providers (traces, metrics, and logs) with OTLP exporters pointed at the Aspire Dashboard:
def _do_setup(service_name: str, service_version: str) -> None:    endpoint = settings.OTEL_EXPORTER_OTLP_ENDPOINT.rstrip("/")
    resource = Resource.create({        SERVICE_NAME: service_name,        SERVICE_VERSION: service_version,        "deployment.environment": settings.ENVIRONMENT,    })
    # Try gRPC first (Aspire default), fall back to HTTP    try:        from opentelemetry.exporter.otlp.proto.grpc.trace_exporter import OTLPSpanExporter        from opentelemetry.exporter.otlp.proto.grpc.metric_exporter import OTLPMetricExporter        span_exporter = OTLPSpanExporter(endpoint=endpoint, insecure=True)        metric_exporter = OTLPMetricExporter(endpoint=endpoint, insecure=True)    except ImportError:        from opentelemetry.exporter.otlp.proto.http.trace_exporter import OTLPSpanExporter        from opentelemetry.exporter.otlp.proto.http.metric_exporter import OTLPMetricExporter        span_exporter = OTLPSpanExporter(endpoint=f"{endpoint}/v1/traces")        metric_exporter = OTLPMetricExporter(endpoint=f"{endpoint}/v1/metrics")
    # Traces    tracer_provider = TracerProvider(resource=resource)    tracer_provider.add_span_processor(BatchSpanProcessor(span_exporter))    trace.set_tracer_provider(tracer_provider)
    # Metrics    metric_reader = PeriodicExportingMetricReader(        metric_exporter, export_interval_millis=15000    )    meter_provider = MeterProvider(resource=resource, metric_readers=[metric_reader])    metrics.set_meter_provider(meter_provider)
    # Auto-instrument libraries    _instrument_httpx()    _instrument_asyncpg()    _instrument_logging()
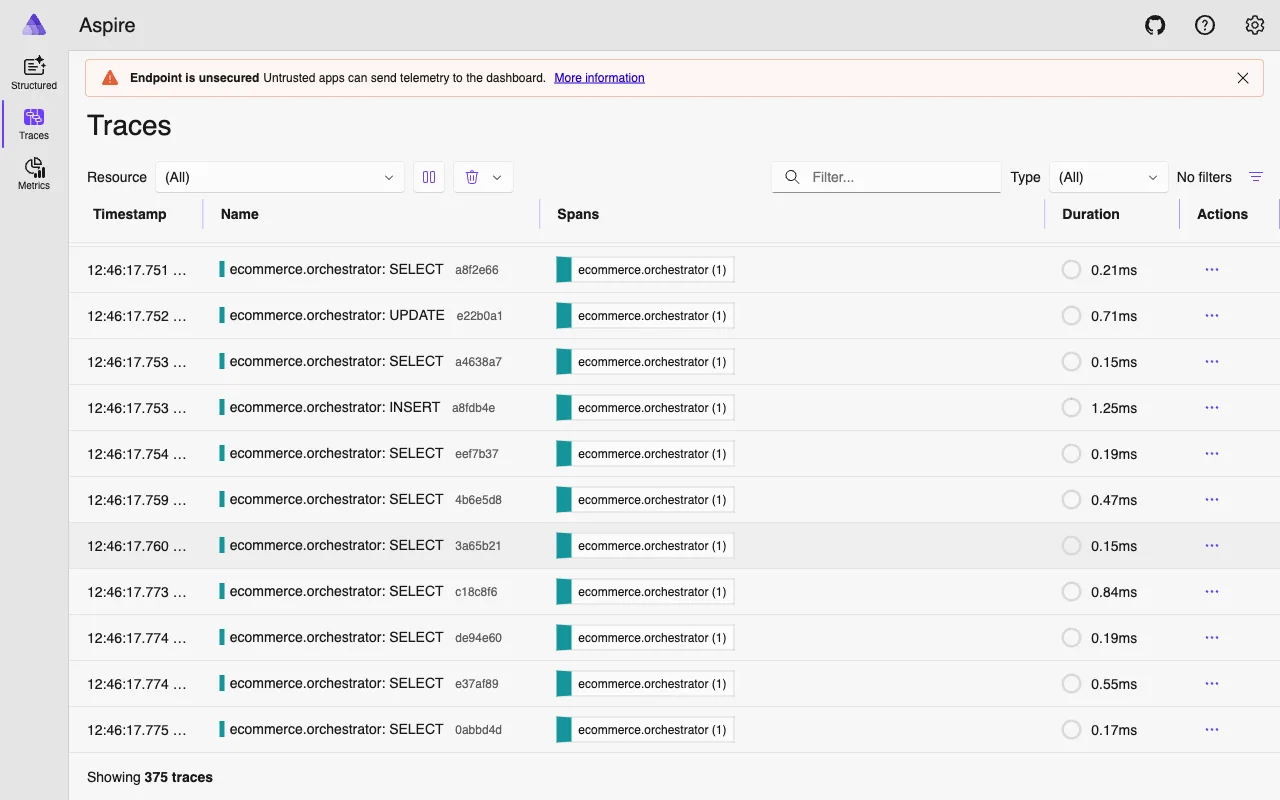
The Resource object tags every span, metric, and log with the service name. This is how the Aspire Dashboard distinguishes between ecommerce.orchestrator and ecommerce.product-discovery in the trace view. The deployment.environment attribute lets you filter by development, staging, or production if you deploy the same telemetry pipeline across environments.
Auto-Instrumentation (Zero Code)
Auto-instrumentation is where OTel earns its keep. After setup_telemetry() runs, four instrumentors silently wrap the libraries your agents already use. No code changes in your agent logic, tools, or routes.
httpx: LLM and A2A Calls
def _instrument_httpx() -> None: try: from opentelemetry.instrumentation.httpx import HTTPXClientInstrumentor HTTPXClientInstrumentor().instrument() except Exception: logger.warning("Failed to instrument httpx — LLM and A2A call spans may be missing")This single call intercepts every outbound HTTP request made by httpx. In ECommerce Agents, that covers two critical paths: OpenAI/Azure OpenAI API calls (every LLM inference) and A2A inter-agent calls (orchestrator to specialist agents). Each request becomes a span with URL, method, status code, and duration. When the orchestrator calls POST https://api.openai.com/v1/chat/completions, you see it in the trace with the exact latency.
asyncpg: Database Queries
def _instrument_asyncpg() -> None: try: from opentelemetry.instrumentation.asyncpg import AsyncPGInstrumentor AsyncPGInstrumentor().instrument() except Exception: logger.warning("Failed to instrument asyncpg — DB query spans may be missing")Every PostgreSQL query executed via asyncpg becomes a span. The span captures the SQL text with parameterized placeholders ($1, $2), not the actual values, so you get query visibility without leaking sensitive data. When a tool runs SELECT * FROM orders WHERE user_email = $1 AND id = $2, you see exactly that in the trace.
FastAPI / Starlette: HTTP Request Spans
def instrument_fastapi(app: Any) -> None: if not settings.OTEL_ENABLED: return try: from opentelemetry.instrumentation.fastapi import FastAPIInstrumentor FastAPIInstrumentor.instrument_app(app) except Exception: logger.exception("Failed to instrument FastAPI")The orchestrator uses FastAPI; specialist agents run on Starlette via A2AAgentHost. Both get instrumented. Every inbound HTTP request creates a root span with the route, method, status code, and duration. These root spans become the top of your trace tree.
Python Logging: Trace Correlation
def _instrument_logging() -> None: try: from opentelemetry.instrumentation.logging import LoggingInstrumentor LoggingInstrumentor().instrument(set_logging_format=False) except Exception: logger.warning("Failed to instrument logging")This injects otelTraceID and otelSpanID into every Python LogRecord. When you see a warning in your logs, you can correlate it back to the exact trace and span that produced it. The set_logging_format=False flag preserves your existing log format; OTel adds the fields without changing how logs look in stdout.
Each instrumentor is wrapped in its own try/except. If one fails (say, the asyncpg instrumentor is not installed), the others still load.
Custom Spans
Auto-instrumentation handles the common cases, but two operations in ECommerce Agents need custom spans.
A2A Call Span
When the orchestrator delegates to a specialist, you want to see “orchestrator called product-discovery” as a logical unit in the trace, wrapping the HTTP call and everything the specialist does. The a2a_call_span() context manager creates this:
@contextmanagerdef a2a_call_span(source_agent: str, target_agent: str, target_url: str): tracer = get_tracer("ecommerce.orchestrator") with tracer.start_as_current_span( "agent.a2a_call", attributes={ "agent.source": source_agent, "agent.target": target_agent, "agent.target_url": target_url, }, ) as span: try: yield span except Exception as e: span.record_exception(e) span.set_status(StatusCode.ERROR, str(e)) raiseUsage in the orchestrator:
with a2a_call_span("orchestrator", "product-discovery", "http://product-discovery:8081/a2a"): result = await a2a_client.send(task)The span attributes let you filter by source/target agent in the dashboard. If the specialist raises an exception, the span records it and sets the error status, so failures are immediately visible in the trace waterfall as red spans.
Traced Tool Decorator
MAF’s @tool decorator defines the tool for the LLM. The @traced_tool decorator adds observability:
def traced_tool(fn: Callable) -> Callable:    tracer = get_tracer("ecommerce")
    @wraps(fn)    async def wrapper(*args: Any, **kwargs: Any) -> Any:        if not settings.OTEL_ENABLED:            return await fn(*args, **kwargs)
        with tracer.start_as_current_span(            "agent.tool_call",            attributes={"tool.name": fn.__name__},        ) as span:            try:                result = await fn(*args, **kwargs)                span.set_attribute("tool.success", True)                return result            except Exception as e:                span.record_exception(e)                span.set_status(StatusCode.ERROR, str(e))                span.set_attribute("tool.success", False)                raise
    return wrapper
Apply it after the MAF @tool decorator:
@tool(name="search_products", description="Search the product catalog")@traced_toolasync def search_products(query: Annotated[str, "Search query"]) -> str: ...Now every tool invocation appears in the trace with its name and success/failure status. When an LLM decides to call search_products, you see exactly how long it took and whether it succeeded.
Cross-Agent Trace Correlation
In a multi-agent system, the thing you actually want is to see one user request as a single trace across every service. Here is how it works.
When the orchestrator makes an HTTP call to a specialist agent via httpx, the httpx instrumentor automatically injects the W3C traceparent header into the outbound request. This header carries the current trace_id and span_id. On the specialist side, the Starlette instrumentor reads the traceparent header from the inbound request and creates a child span under the same trace.
The result: one trace, spanning two services, with full parent-child span relationships preserved.
A user asks about an order
- POST /api/chatecommerce.orchestrator
- FastAPI root span
- POST api.openai.comhttpx auto-span
- intent classification
- agent.a2a_callcustom span
- target = order-management
- POST order-management:8082/a2ahttpx auto-span
- carries traceparent
- Starlette request spanecommerce.order-management
- reads traceparent, joins the trace
- POST api.openai.comhttpx auto-span
- specialist reasoning
- agent.tool_call: get_order_statustraced_tool span
- SELECT ... FROM ordersasyncpg auto-span
and the answer comes back up the same tree
traceparent, the specialist's Starlette middleware reads it, and everything below indents under the request that caused it instead of starting a second trace.In the Aspire Dashboard, this renders as a single trace with a waterfall view. You see the orchestrator’s HTTP entry, the LLM call for intent classification, the A2A delegation, the specialist’s processing, the specialist’s LLM call, the tool execution, and the database query, all nested correctly with timing information.
This is what makes debugging a 12-second response possible. You open the trace, see that the order management LLM call took 8 seconds, and know exactly where to look.
Aspire Dashboard
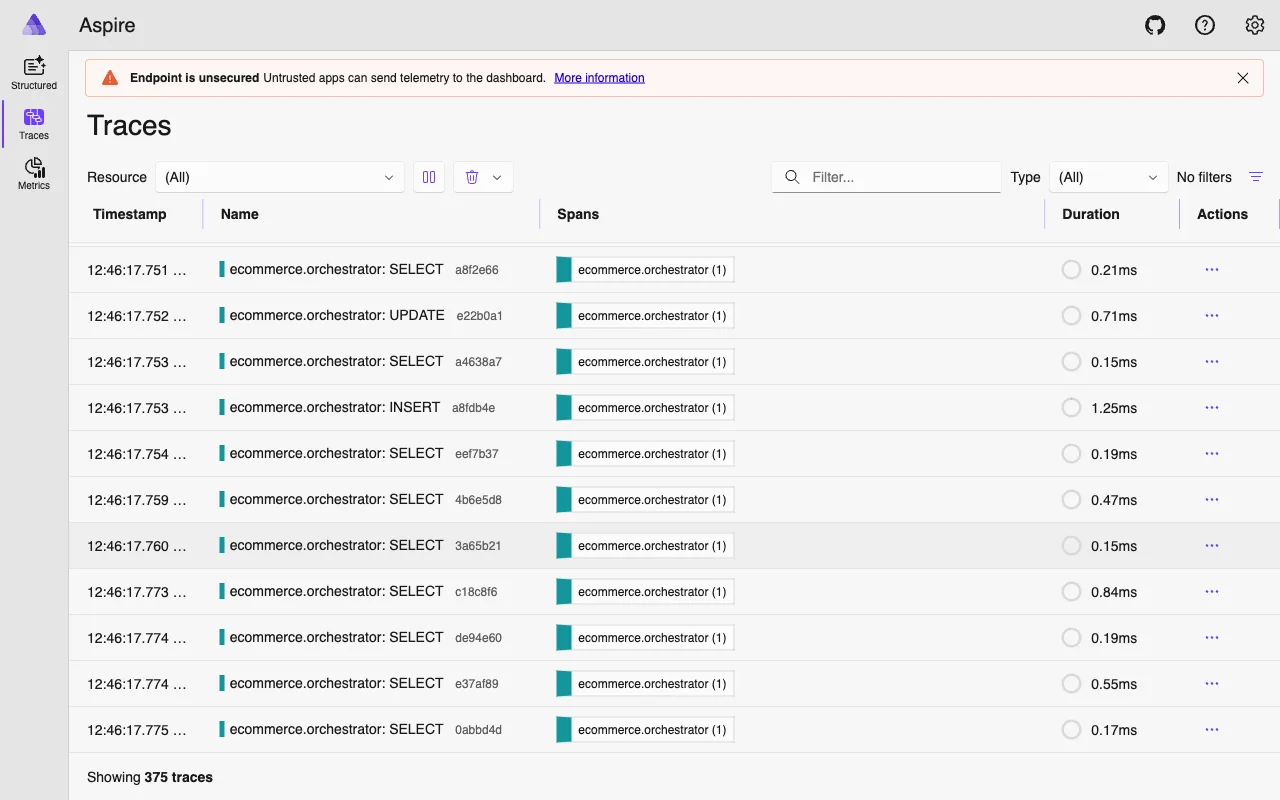
The .NET Aspire Dashboard is the observability UI for ECommerce Agents. It runs as a Docker container and provides a unified view of traces, metrics, logs, and resources, with no need for separate Jaeger, Prometheus, and Grafana instances.
Access: http://localhost:18888
The Docker Compose configuration is straightforward:
aspire: image: mcr.microsoft.com/dotnet/aspire-dashboard:latest ports: - "18888:18888" # Dashboard UI - "18890:18889" # OTLP receiver environment: DASHBOARD__FRONTEND__AUTHMODE: UnsecuredEvery agent depends on the Aspire container and exports telemetry to http://aspire:18889 inside the Docker network. The dashboard UI is exposed on port 18888 on the host.
What You See
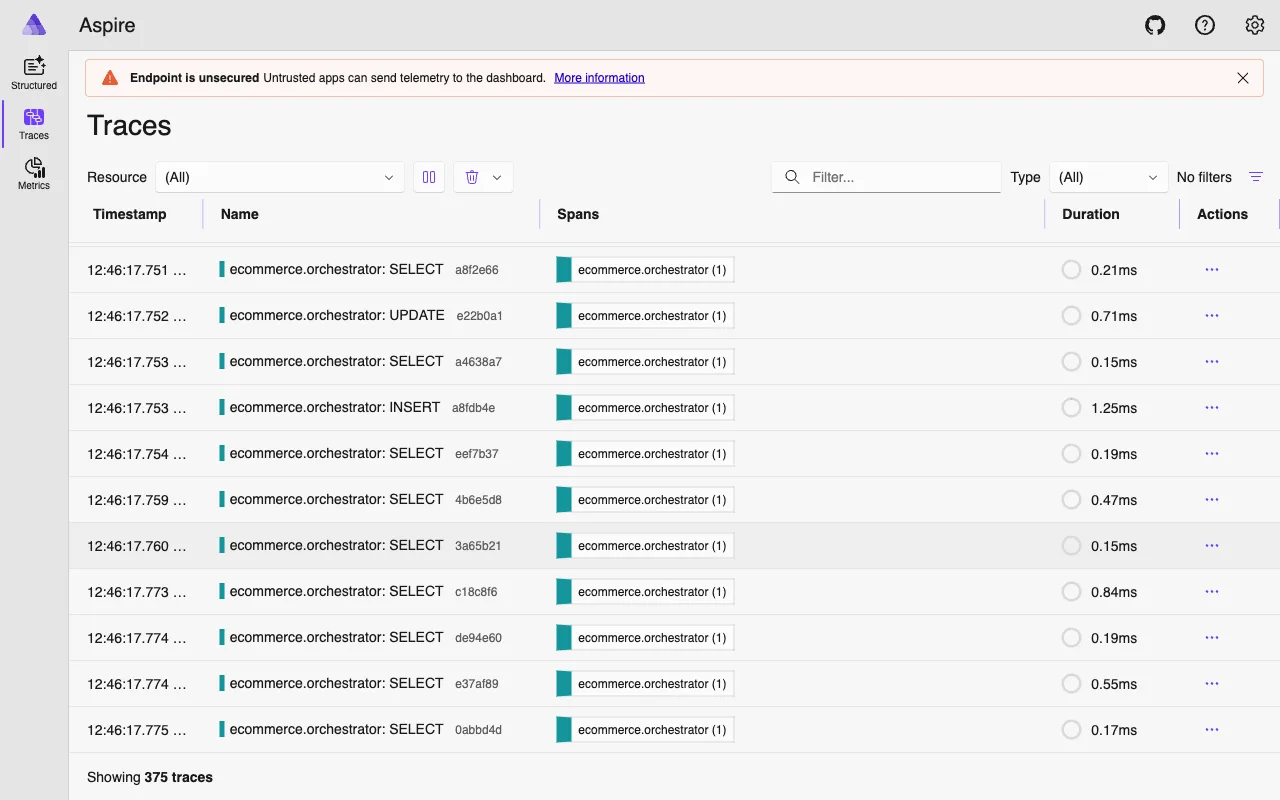
- Trace list. Every trace across every agent, filterable by service, duration, and status. Sort by duration to surface the slowest requests instantly.
- Span waterfall. Click a trace for the full span tree with timing bars. Parent-child structure, durations, and attributes are all there; error spans show in red.
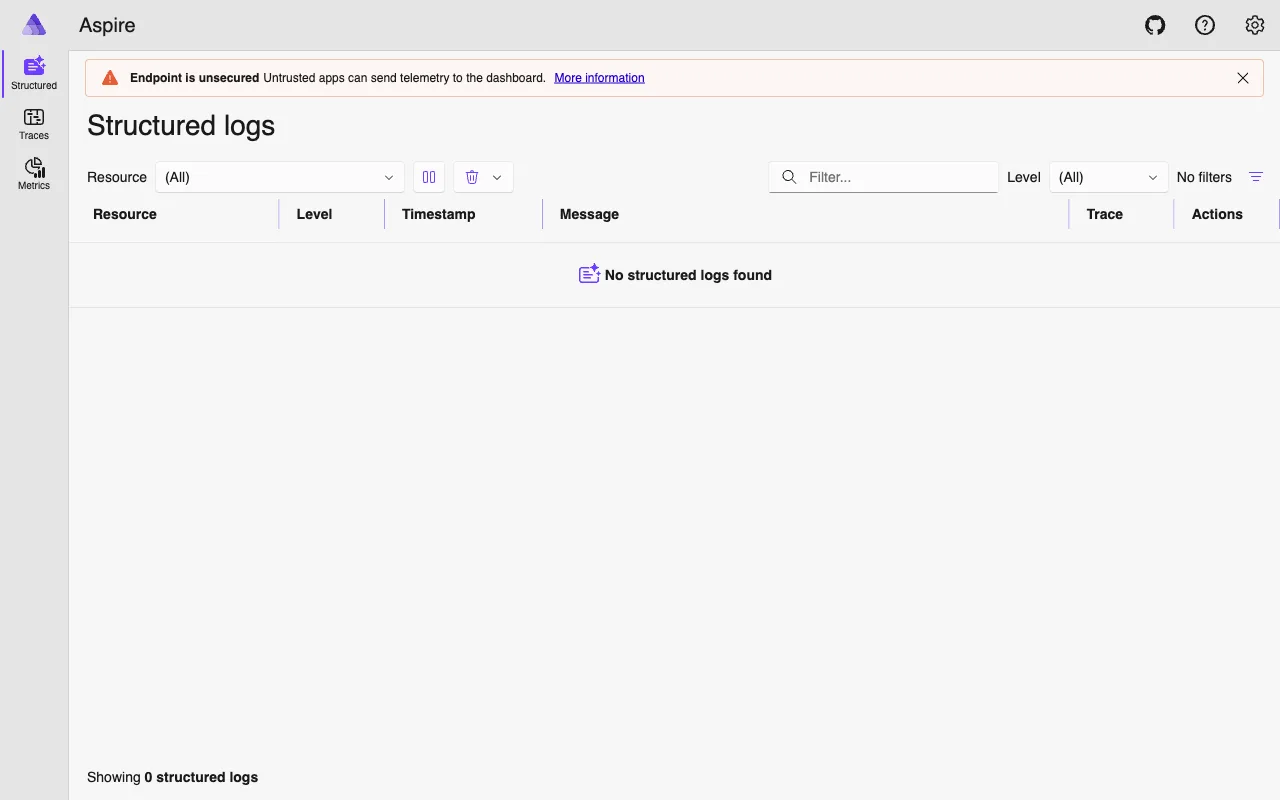
- Structured logs. Correlated with traces via
trace_id. Open a trace to see every log line emitted during that request, across all agents involved. - Metrics. Request counts, latency distributions, and error rates per service, exported every 15 seconds.
- Resources. Every registered service with its
service.name,service.version, anddeployment.environmentattributes.
Typical Investigation Flow
- User reports a slow response: go to Traces, filter by
ecommerce.orchestrator, sort by duration descending. - Open the slow trace and expand the span waterfall to find which child span took the longest. Is it an LLM call? A database query? An A2A delegation?
- If the bottleneck is an A2A call, the specialist’s spans are nested inside the same trace. Drill into them.
- Cross-reference with Structured Logs to see any warnings or errors logged during that request.
- Check the
trace_idagainst the admin audit API (GET /api/admin/audit) for the application-level usage record.
Usage Tracking
Beyond operational observability, ECommerce Agents records agent usage for analytics and billing. The log_agent_usage() function writes to the usage_logs table with a critical detail: it captures the current trace_id from the active OTel span.
async def log_agent_usage(    user_id: UUID | str | None,    agent_name: str,    session_id: UUID | str | None = None,    input_summary: str = "",    tokens_in: int = 0,    tokens_out: int = 0,    tool_calls_count: int = 0,    duration_ms: int = 0,    status: str = "success",    error_message: str | None = None,) -> UUID | None:    pool = get_pool()    trace_id = get_current_trace_id()
    row = await pool.fetchrow(        """INSERT INTO usage_logs           (user_id, agent_name, session_id, trace_id, input_summary,            tokens_in, tokens_out, tool_calls_count, duration_ms, status, error_message)           VALUES ($1, $2, $3, $4, $5, $6, $7, $8, $9, $10, $11)           RETURNING id""",        str(user_id) if user_id else None,        agent_name, str(session_id) if session_id else None,        trace_id, input_summary[:500] if input_summary else None,        tokens_in, tokens_out, tool_calls_count,        duration_ms, status, error_message,    )    return row["id"] if row else None
The trace_id column creates a bridge between the application’s audit log and the distributed trace in Aspire. When the admin dashboard shows a usage record, you can take the trace_id and search for it in the Aspire Dashboard to see the full execution trace. This bidirectional link between business-level analytics and operational telemetry is surprisingly useful during incident investigation.
The get_current_trace_id() helper extracts the trace ID from the active OTel context:
def get_current_trace_id() -> str | None: span = trace.get_current_span() ctx = span.get_span_context() if ctx and ctx.is_valid: return format(ctx.trace_id, "032x") return NoneA companion UsageTimer context manager handles duration measurement, and log_execution_step() records individual tool invocations within a request for detailed step-by-step audit trails.
Gotchas and Production Concerns
A few things we learned the hard way:
- gRPC vs HTTP exporters. The Aspire Dashboard supports both. We try gRPC first (lower overhead, better for high throughput) and fall back to HTTP if the gRPC exporter isn’t installed. In production, pick one and pin it.
- Batch vs simple processors. Traces use
BatchSpanProcessor(SDK defaults: 5s interval, 512-span batch) for efficiency; logs useSimpleLogRecordProcessor(immediate export) for real-time correlation in Aspire. Fine for development, but review the batch settings for production loads. - Token counts are not auto-captured. OTel doesn’t instrument OpenAI token usage out of the box. The
usage_logstable records token counts, but those come from parsing the LLM response, not from spans. Per-span token attribution needs custom span attributes.
What’s Next
Observability gives you visibility into what your agents are doing. But your users don’t look at traces; they look at a UI. In Part 6, we build the frontend experience with Next.js 15 and React 19, turning agent text responses into interactive product cards, order timelines, and clickable action buttons that feed back into the conversation.
Comments
Comments are GitHub discussions. Sign in with GitHub to post; reactions need no account.